[Note: LTEE veterans, feel free to skip the first paragraph, but take note of the mutation in red—the ‘Chekhov’s mutation’ of this little narrative, as it were.]
In 1988, Prof. Richard Lenski began growing twelve populations of E. coli: six “Ara−” populations from a strain incapable of using arabinose (REL606) and six “Ara+” populations from a nearly identical strain capable of using arabinose (REL607).1 These twelve populations make up the E. coli long-term evolution experiment (LTEE), and they’ve been transferred to fresh media nearly every day since. The two ancestral strains of the LTEE differ by the mutation D92G (GAC→GGC) in the araA gene. This mutation restores functionality of the enzyme L-arabinose isomerase in REL607 by reverting an earlier mutation in REL606, re-enabling arabinose utilization by REL607 and its descendants in the Ara+ populations.2 This mutation in araA is neutral with respect to fitness in the minimal glucose environment of the LTEE, but it yields a color change from red (Ara−) to white (Ara+) in colonies plated on tetrazolium arabinose (TA) agar. The difference in phenotype makes this a useful marker for tracking the abundance of Ara– and Ara+ cells when populations or strains of the two different types are competed to measure fitness.3
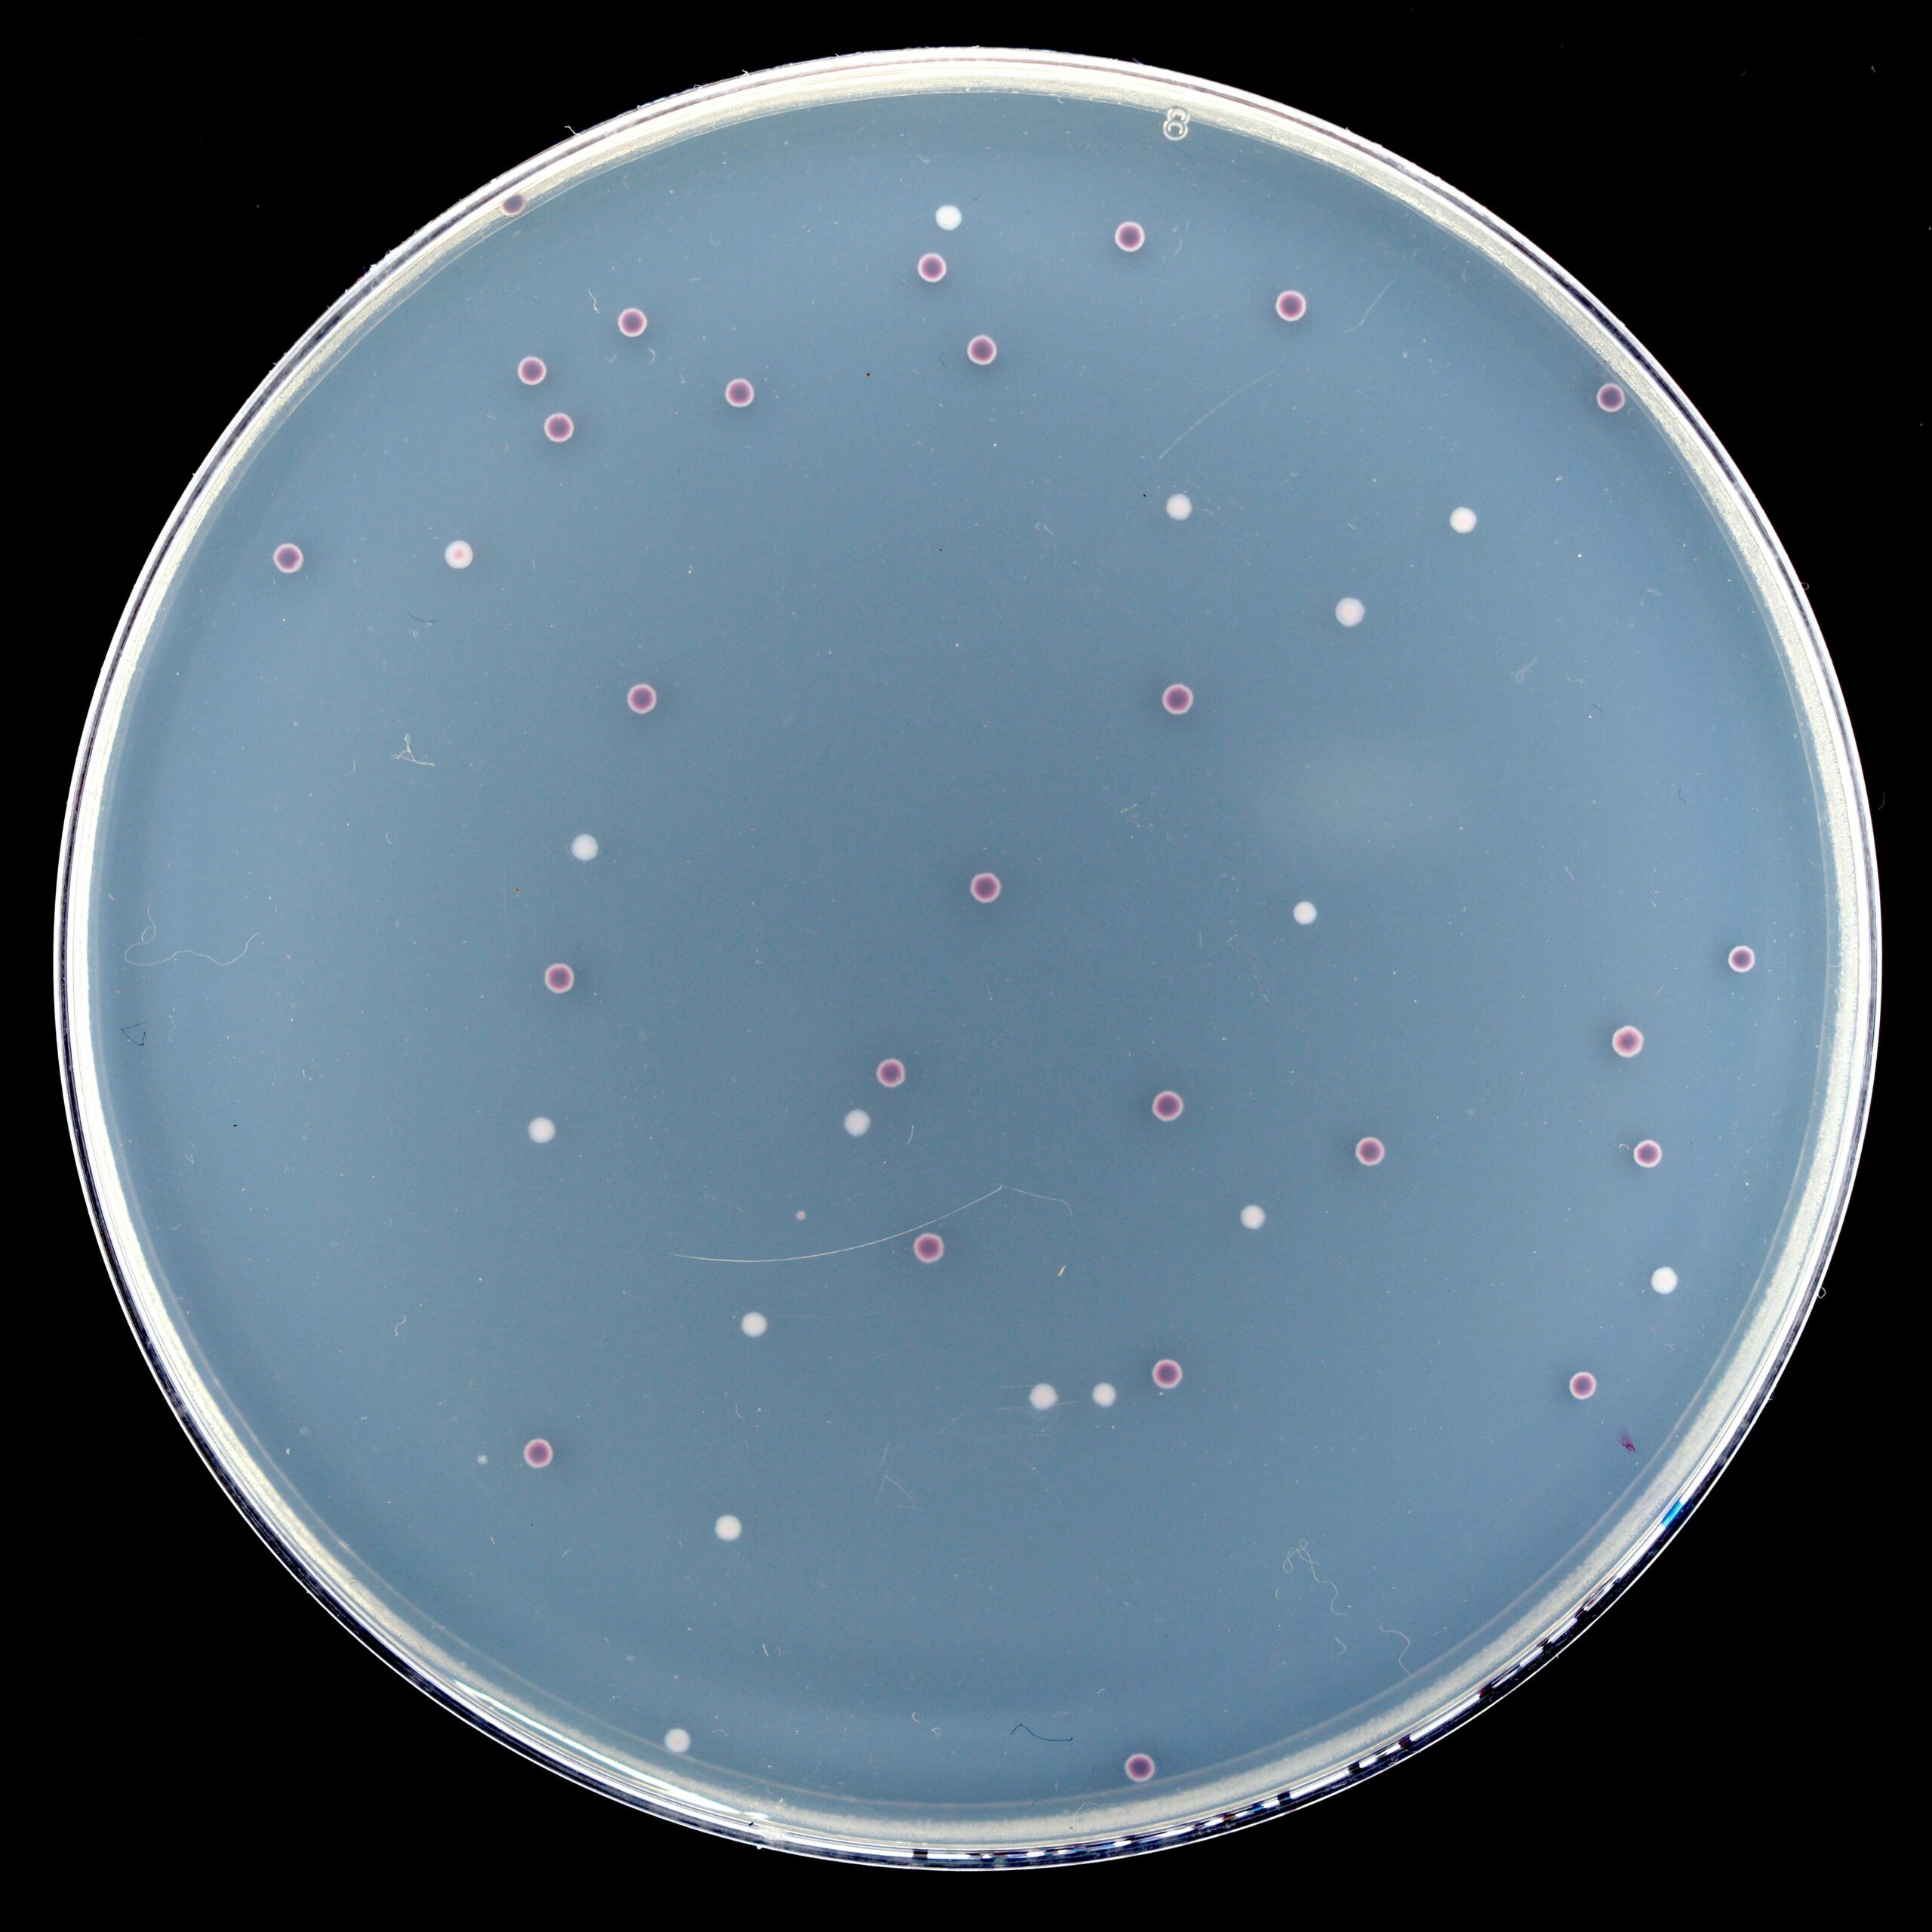
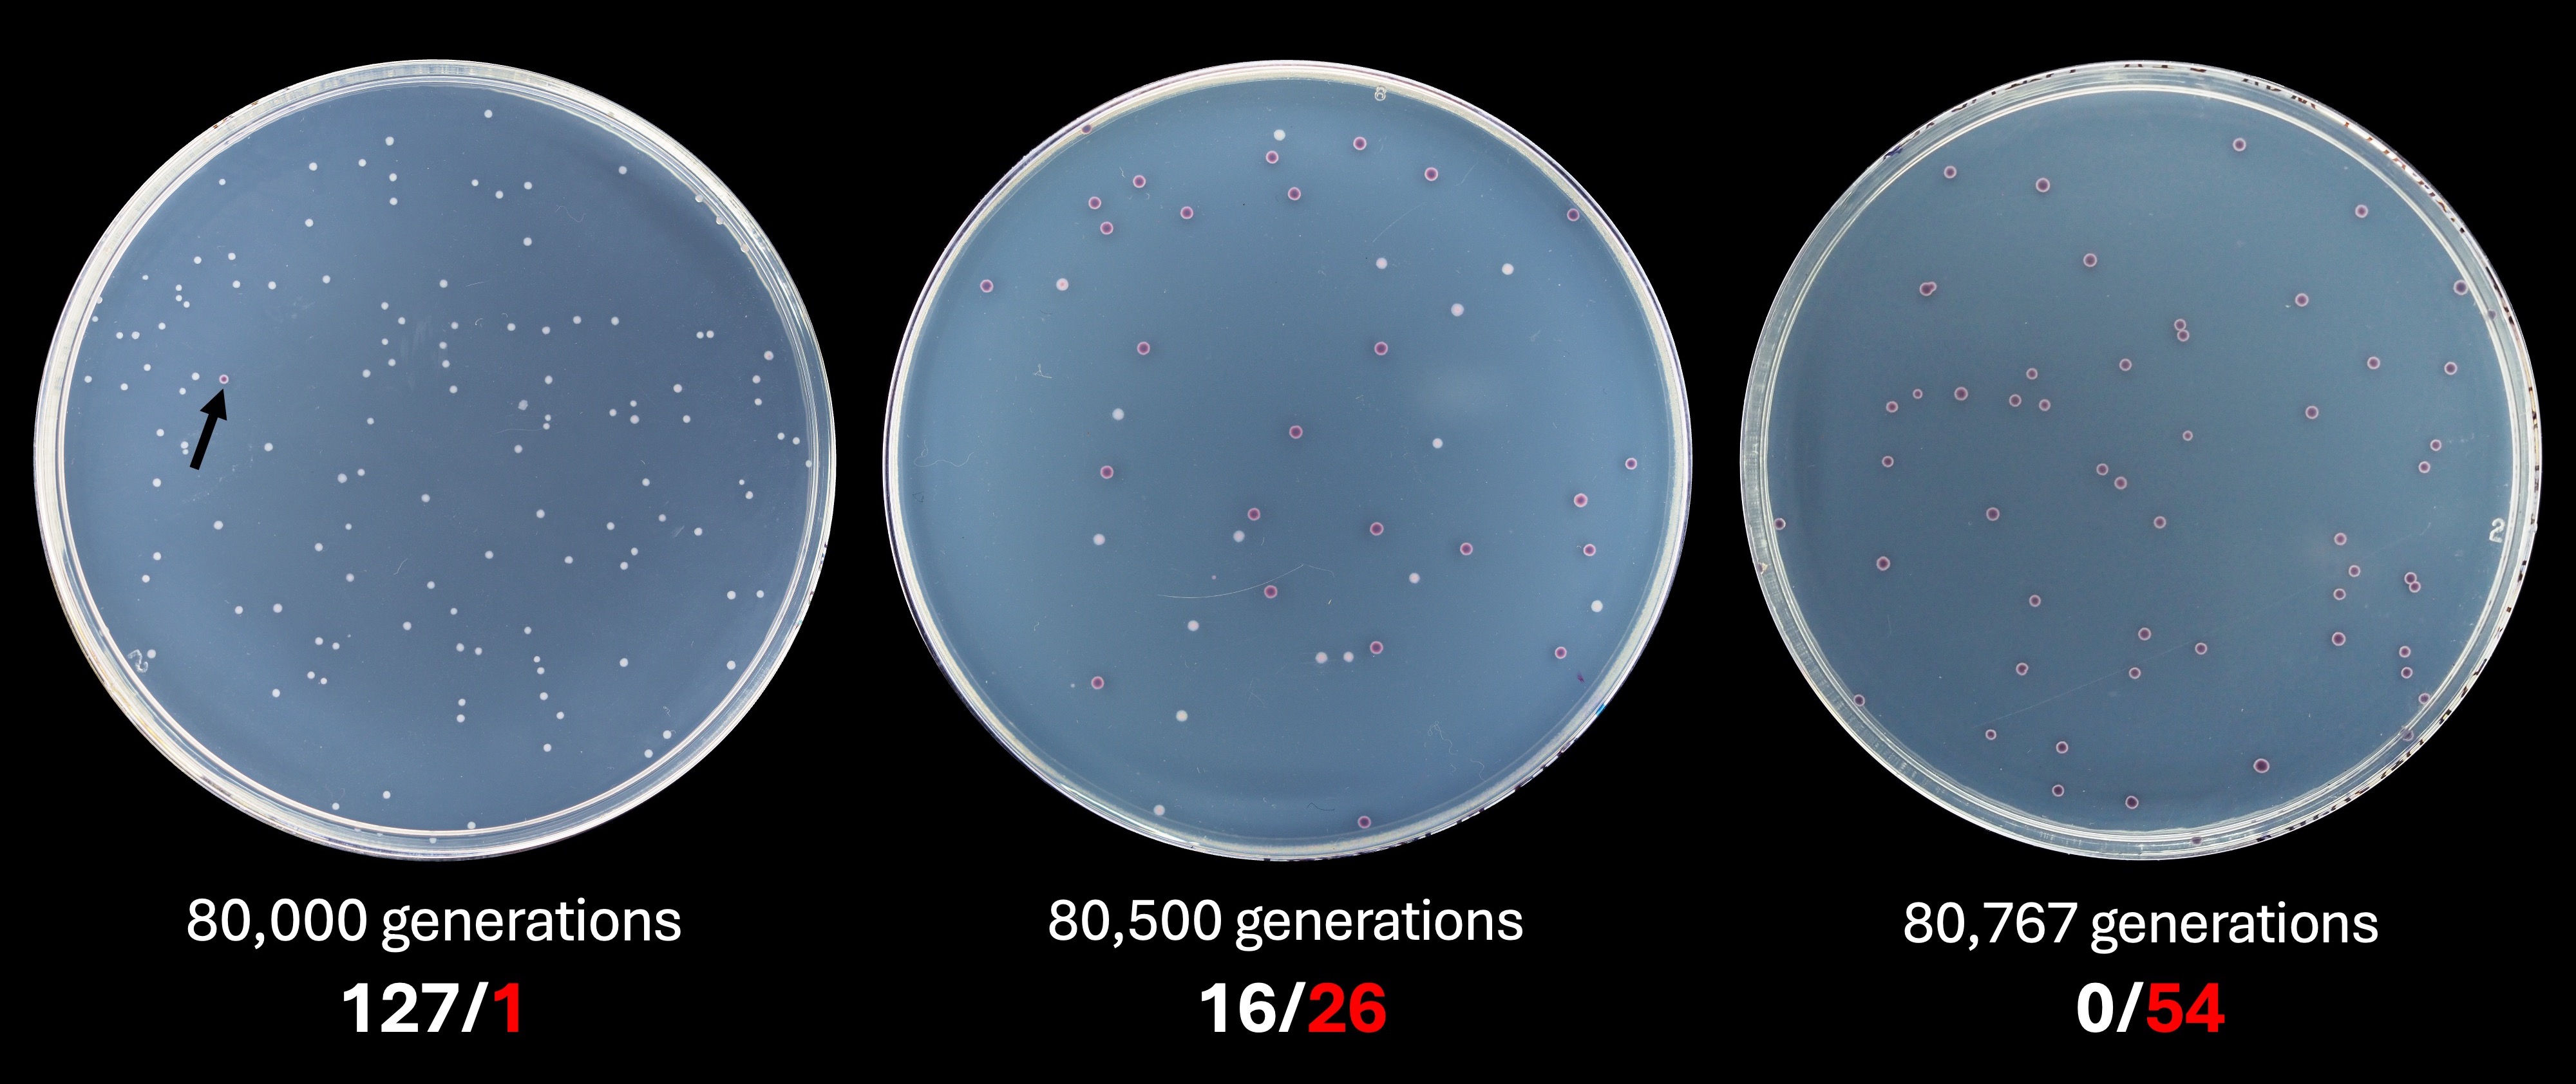
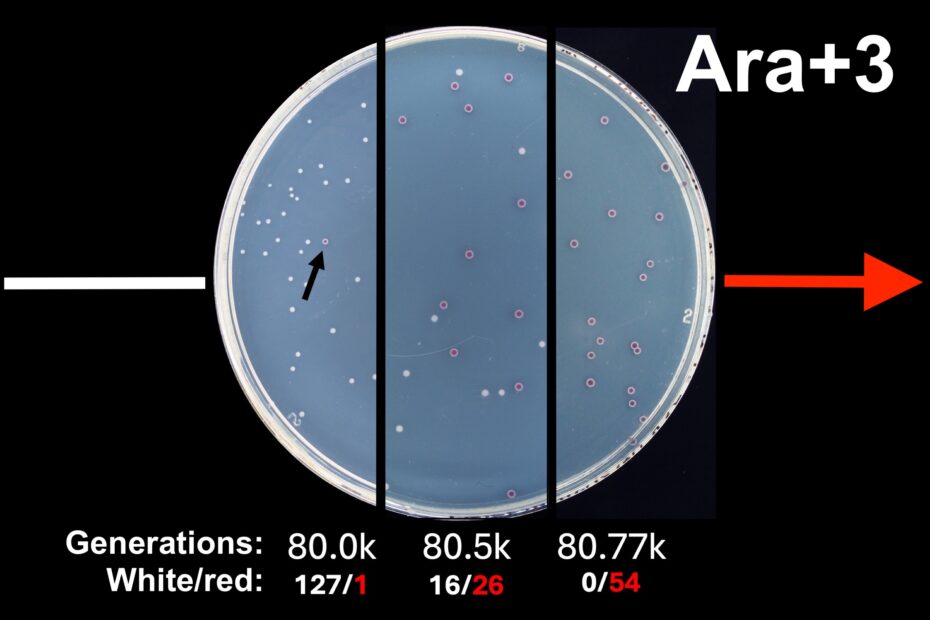
The LTEE moved to the Barrick Lab at UT Austin in 2022, and when I was hired as lab manager in July 2024, the proverbial torch (Bunsen burner?) of day-to-day LTEE operations was passed on to me. More specifically, I’m responsible for the daily population transfers, and I plate the populations every 500 generations to check for contamination or changes in phenotype as new samples are archived in the frozen ‘fossil’ record. When I plated the populations at 80,500 generations, however, I noticed something odd. Ara+3 had grown both red and white colonies on TA agar in approximately equal amounts. Though the REL606 and REL607 ancestors form colonies after only 24 hours on TA agar, many evolved populations do not grow as well on these plates because they are unlike the LTEE environment. It took ~48 hours for both red and white colonies to grow in this case.

My first thought was that there had been cross-contamination by an Ara− strain either during transfers or plating. I tested this hypothesis via diagnostic PCR on three red and three white colonies, targeting the rbs operon which contains a deletion that varies in size between the twelve populations. The predicted product size for Ara+3 was 863 bp, and all six of my samples (both red and white) produced a clear band about halfway between 700 and 1000 bp, suggesting that the red colonies might genuinely be from Ara+3. In parallel, I re-plated Ara+3 at 80,540 generations (no picture) and observed the same colony dimorphism, although surprisingly the red colonies had gone on to vastly outnumber the white. I also looked back at photos from the previous plating at 80,000 generations and noticed that Ara+3 on TA had just one red colony among a hundred or so white colonies. The obvious next step was to sequence the genomes of a red colony and a white colony to figure out exactly what was going on.
The sequencing results from my run on our lab’s MiniON revealed that the red colonies shared nearly all of their mutations with the white colonies and clones sequenced from population Ara+3 at earlier generations. Everything was fine—no contamination! Our ‘Red Scare’ was over. But what caused it?
I was stunned when Prof. Barrick announced that the change in phenotype from white to red was caused by the araA mutation G92D (GGC→GAC), an exact nucleotide-for-nucleotide reversion of the mutation that separated REL607 from REL606 decades ago—something which has never been observed in the LTEE’s 30+ years. Nearby mutations in the red and white colony genome sequences are consistent both with each other and with previous generations of Ara+3, making it unlikely that the mutation resulted from horizontal gene transfer by a rogue Ara− contaminant.
This mutation is consistent with the hypermutator signature of a mutS defect that evolved in this population, but as Prof. Barrick put it, it’s a little ‘spooky’ that the change was caused by this exact mutation when many others could also lead to a loss of araA function. It’s possible that this site is some kind of ‘hotspot’ in the gene that mutates at an especially high rate or that other loss-of-function mutations in AraA are deleterious in a way that this particular mutation is not, perhaps because they lead to defective proteins that misfold or have other side-effects.

I recently plated Ara+3 again at 80,767 generations purely to satisfy my own impatient curiosity. On this occasion, there was not a single white colony on the TA agar plate after 48 hours of incubation, but I counted 54 red colonies. I have yet to double-check the identity of these colonies via diagnostic PCR using the rbs operon, let alone via sequencing, but I hypothesize that they’re genuinely Ara+3 based on previous results.
I’m still struck by the colony ratios from my follow-up plating, as they indicate I may have caught the red subpopulation in the midst of a population sweep when I archived the populations at 80.5k. I also can’t help but wonder about the sheer probability that this exact mutation would become the majority in the population, especially because this mutation in araA is neutral in the experimental environment. That then raises the question of what mutations in the red subpopulation have given it an advantage over the white subpopulation, since this reversion must have ‘hitchhiked’ along with one or more beneficial mutations. I’ll be plating again at 81,000 generations in early January as part of the archiving process, and I’m looking forward to seeing how my new favorite LTEE population has developed!
- Lenski, R. E., Rose, M. R., Simpson, S. C., & Tadler, S. C. (1991). Long-term experimental evolution in Escherichia coli. I. Adaptation and divergence during 2,000 generations. The American Naturalist, 138(6), 1315-1341. https://doi.org/10.1086/285289
- Studier, F. W., Daegelen, P., Lenski, R. E., Maslov, S., & Kim, J. F. (2009). Understanding the differences between genome sequences of Escherichia coli B strains REL606 and BL21 (DE3) and comparison of the E. coli B and K-12 genomes. Journal of Molecular Biology, 394(4), 653-680. https://doi.org/10.1016/j.jmb.2009.09.021
- Barrick, J. E., Blount, Z. D., Lake, D. M., Dwenger, J. H., Chavarria-Palma, J. E., Izutsu, M., & Wiser, M. J. (2023). Daily transfers, archiving populations, and measuring fitness in the long-term evolution experiment with Escherichia coli. Journal of Visualized Experiments, (198). https://doi.org/10.3791/65342
